Debugging
Logic Driver supports visual debugging with the Blueprint Editor.
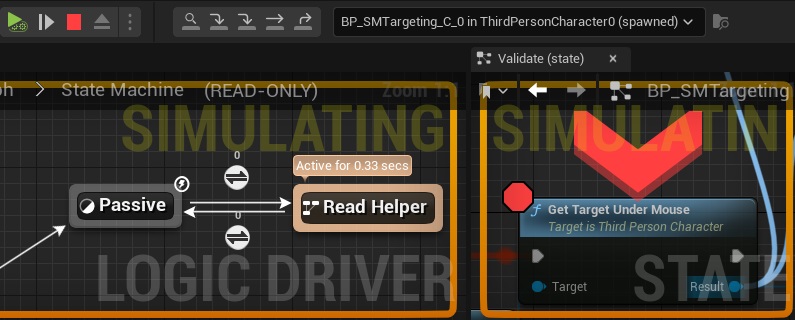
Active States and Transitions
Active states are highlighted with the time spent in the state displayed. Transitions that are currently evaluating are animated.

When a play session is in progress you can select a debug object for a state machine, similar to debugging other blueprints. This will then display active states and transitions within this state machine instance.

Breakpoints
Breakpointing on individual blueprint nodes works just like in other Blueprint Editors, and execution can be paused and stepped through within local state graphs.
State Breakpoints  
Individual states can add, remove, toggle, enable, or disable breakpoints.

A breakpoint is triggered when a state becomes active that has an enabled breakpoint. Execution will stop and focus on the state.
Breakpoint Events
State debugging only occurs On State Begin. Other events, such as On State Update and On State End require breakpoints set within local graphs.

Debugger Commands 
Standard blueprint debugging commands work with Logic Driver state machine blueprints. These commands let you move between Logic Driver states and standard blueprint nodes, providing a consistent debugging workflow.

From left to right the commands are:
- Locate the active node (focus in on the active node)
- Continue execution until the next breakpoint is hit
- Step Into
- Step Over
- Step Out
Step Into
Stepping into a state will single step into the next node to execute on the stack. A State Machine state will step into its state machine graph. A state will then step into its local graph's On State Begin blueprint node.

Step Over
Stepping over a state will attempt to break at whichever directly connected output state is triggered next. If at an end state, the debugger will attempt to step out if possible. This can occur in the future, and not within a single frame.

Step Out
Stepping out of a state will move up to the next state to be hit in the owning state machine graph if possible. This can occur in the future, and not within a single frame.

Temporary Breakpoints
When stepping over or stepping out, a temporary breakpoint may automatically be set on several states. These breakpoints exist only until one of these states is hit, another debug command is executed, or when execution occurs outside of these states within the state machine.


This is specific to Logic Driver and is to account for:
- Multiple outputs
- In traditional blueprint debugging, there is a set execution path that is taken, almost always linearly. With a state machine there are multiple possible states that could be triggered next.
- Time
- Unlike traditional debugging, we don't always execute within the same tick and a state might transition immediately, or it might be seconds later or more.
Display Temporary Breakpoints
Temporary breakpoints UI visibility can be toggled under the Editor Preference page Logic Driver Editor and changing the setting, Display Temporary Breakpoints.
Technical Details
Another reason for using temporary breakpoints is to work around limitations in Unreal Engine’s Blueprint debugger. Much of the debugger’s implementation is private, and some of the internal data that Logic Driver needs to read or modify is not directly accessible. Automatically placing breakpoints provides a reliable way to bridge that gap.
To determine which debugging command is executed, when it is executed, and to correctly respond to Blueprint debugging hotkeys, Logic Driver must intercept certain editor commands. This is done by hooking the debugging and PIE commands exposed through the Level Editor toolbar and Blueprint Editors, and wrapping them with Logic Driver specific handlers.
Each Logic Driver command wrapper first determines whether it should take effect by checking whether a Logic Driver state machine is present in the call stack and whether one of Logic Driver’s debug script execution points is currently active (for example, On State Begin). If these conditions are not met, the original Unreal Engine command is executed unchanged.
This approach is intentionally conservative and lightweight, with the goal of avoiding any interference with standard Blueprint debugging when Logic Driver is not actively involved.
Disabling Command Hooks
In case there is a problem, Logic Driver's debug hooks can be disabled by unchecking Project Settings -> Logic Driver Editor -> Enable Debug Command Hooks.
Active Debugging 
While playing in PIE it is possible to forcibly switch active states and take transitions through the Blueprint Editor debugger.
To enable active debugging, a valid debug object must be set in the blueprint debugger. The state machine must already be initialized and started.
- Right click on a state to toggle whether it is active or not with
SetActive.- This does not deactivate any other states.
- Right click a transition outgoing from an active state and select
Take Transitionto trigger that transition. The transition will act as though it evaluated to true through conditional (tick) evaluation, even if it evaluates to false.- In the event of conduits with branching transitions, you must assemble the transition chain you want to take by selecting all of the transitions in order that you wish to evaluate. You don't need to select the entire chain, just enough so that there is only one possible chain that can be executed based on the total transitions.
Take Transition is Most Accurate to Runtime Behavior
Triggering a transition will cause the system to behave the most similar to runtime, causing the previous active state to run its On State End behavior, call On Transition Entered, and then switch to the next state.
Breakpoints Do Not Work with Active Debugging
When the blueprint debugger is in a breakpoint, active debugging will not be available. It is too inaccurate to allow, since the breakpoint has already paused script execution, which will still continue even after switching the state. You can, however, pause the blueprint debugger and utilize active debugging.